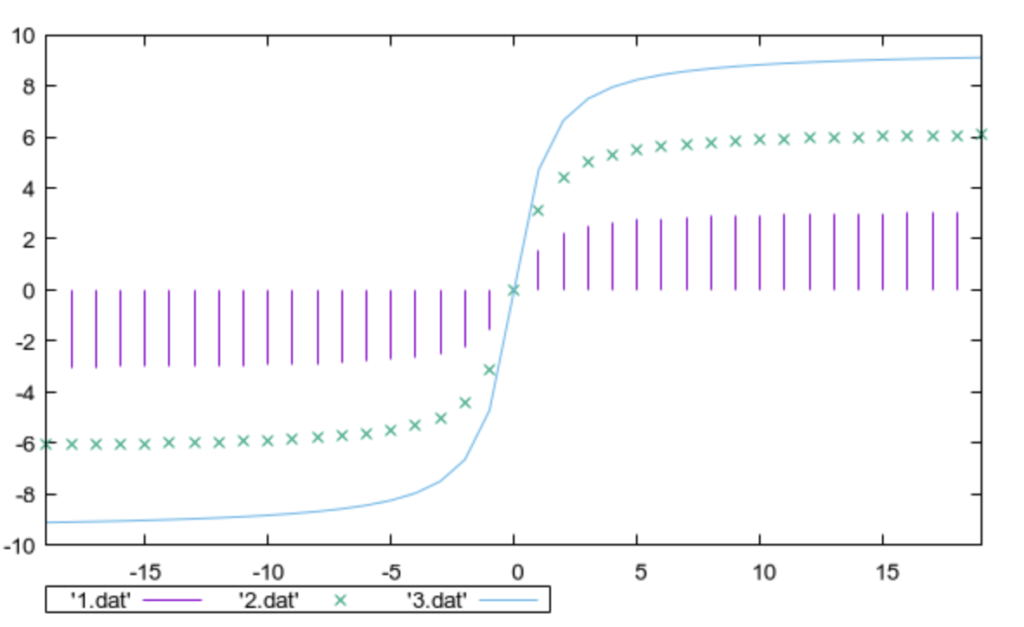
Both Gnuplot and Excel are tools commonly used for data visualization, but they have different features and use cases. Let’s explore how you can use both for creating charts and graphs.
Gnuplot:
Gnuplot is a powerful, command-line-driven plotting program. You typically create a script with Gnuplot commands to generate plots. Here’s a simple example:
- Create a Data File:
Suppose you have a file nameddata.txtwith the following content:
   1 2
   2 5
3 1- Create a Gnuplot Script:
Create a script file (e.g.,plot_script.gnu) with the following content:
   # plot_script.gnu
   set terminal png
   set output 'output_plot.png'
   plot 'data.txt' with linespoints
This script sets the terminal to PNG and outputs the plot to a file named output_plot.png.
- Run Gnuplot:
Open a terminal, navigate to the directory containing your script and data file, and run:
gnuplot plot_script.gnuThis will generate an output plot image.
Excel:
Excel is a spreadsheet program that includes powerful charting capabilities. Here’s a simple example:
- Enter Data in Excel:
Open Excel and enter your data in columns. For example:
   A    B
   1    2
   2    5
3 1- Create a Chart:
- Select the data you entered.
- Go to the “Insert” tab and choose a chart type (e.g., Line Chart).
- Customize the Chart:
- You can customize the chart by right-clicking on various elements (axes, data series, etc.) and selecting formatting options.
- Save or Export:
- Save the Excel file. You can also copy the chart and paste it into other applications (e.g., Word or PowerPoint).
- Optionally, export the chart as an image from Excel.
Combining Gnuplot and Excel:
If you have data in Excel and want to use Gnuplot for more customization, you can export the data from Excel and use it in a Gnuplot script:
- Export Data from Excel:
- In Excel, go to “File” > “Save As” and save the data as a text file (e.g.,
data_from_excel.txt).
- Use Gnuplot:
- Create a Gnuplot script similar to the one shown earlier but using the new data file.
- Run the Gnuplot script.
This way, you can leverage the strengths of both tools depending on your specific needs. Gnuplot is particularly useful for creating complex plots and visualizations, while Excel provides a user-friendly interface for quick and standard charting tasks.
